
What the Data Says About RPGs on Kickstarter
Code & data: the full reproducible pipeline (Python + R) and figures live in a separate repository — github.com/alchemical-lich/ttrpg-kickstarter. This page is the write-up.
Note: The analysis and write-up were generated with the help of Claude Code—since this was done on a whim, I didn’t feel the need to do everything by hand.
A while back I read a great guest post on Patchwork Paladin about Kickstarter “whales” — the analysis where Scipio202 went through ENWorld’s list of fifty-three tabletop RPG campaigns that raised a million dollars or more and pulled apart their reward tiers.1 The headline finding stuck with me: across those mega-projects, the high-end “whale” tiers brought in roughly 23% of all the money, vastly more than the cheap entry tiers (under 4%), and the sweet-spot whale tier clustered around a sensible ~$478, nowhere near the $5,000 dragon-hoard you might picture.
It’s a lovely piece of detective work. But fifty-three projects is fifty-three projects, and all of them already won. I kept wondering about the rest of the ttrpg Kickstarter projects out there: not “how do the giants structure their tiers,” but “what does the whole RPG corner of Kickstarter actually look like, including the projects nobody remembers?” So I went looking for more data and what I found turned into equal parts answers and cautionary tales. This post is the tour. I’ll give you the findings, but I’ll also be honest about the places where the data were messy and misleading, because those are half the fun.
Step one: get the data. Step two: distrust it.
There’s a wonderful free resource called Web Robots that has been crawling Kickstarter roughly once a month since 2014 and posting the results. I stitched together more than a hundred of those monthly snapshots, deduplicated everything, and ended up with about 45,000 tabletop-games projects. Tabletop is a messy category — it lumps board games, card games, miniatures, dice, and actual roleplaying games together — so I built a keyword classifier to sort RPG rulebooks and adventures (~10,800 of them) and RPG-specific accessories like dice and minis (~4,000) out from the boardgame crowd.2
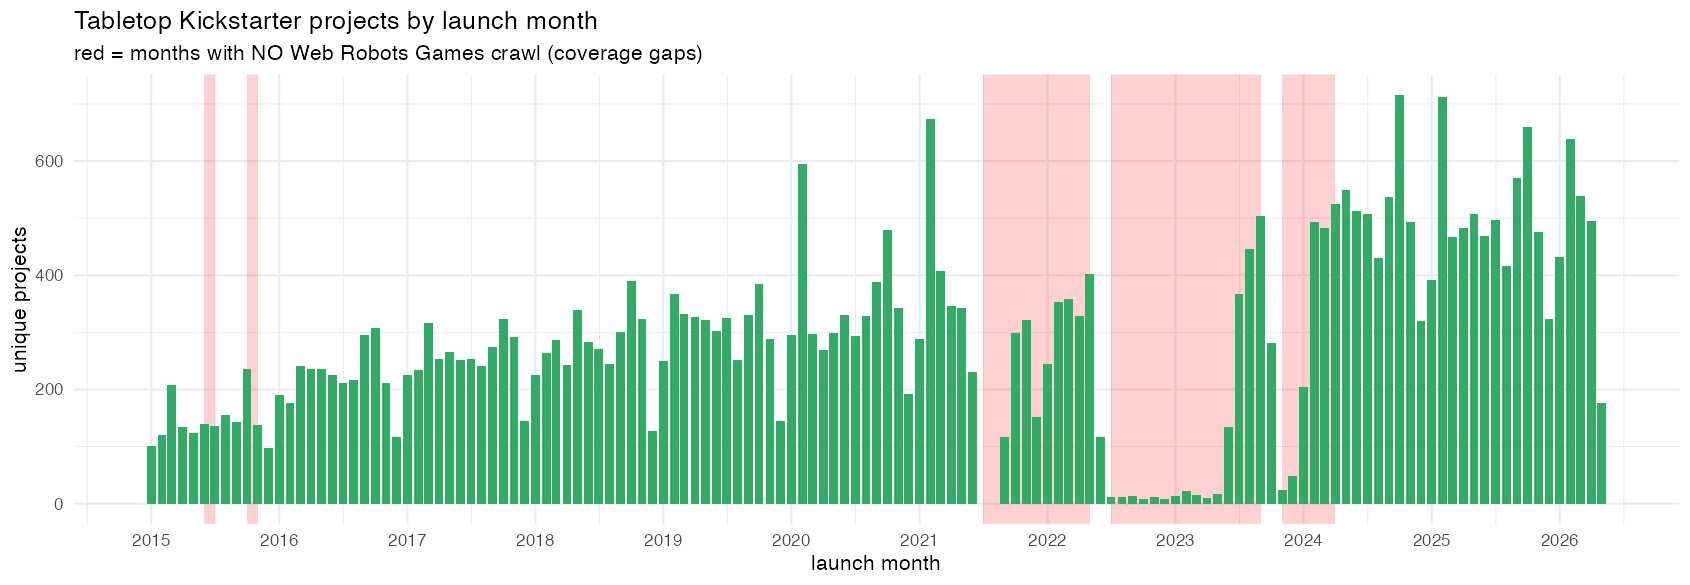
RPG-related launches by month, from the stitched-together monthly crawls. The red bands mark months where the crawl missed the Games category entirely — including a stretch that, frustratingly, lands right on the 2023 OGL crisis.
Then I did the first thing anyone does: I checked the success rate. The data said tabletop RPGs succeed about 98% of the time.
That number is garbage, and recognizing why it’s garbage is the single most important thing in this whole analysis. Web Robots builds its snapshots from Kickstarter’s public “discover” pages — and those pages overwhelmingly surface projects that are live or that succeeded. Campaigns that flopped quietly fall out of view and never make it into the crawl. So what the crawl really captures is the survivors — the live and the victorious — with the quiet failures missing almost entirely.3 Asking it for a success rate is like surveying lottery winners about the odds of winning the lottery.
This is survivorship bias, and it quietly reshapes the entire project. It means there are two completely different questions hiding inside “what makes a campaign succeed,” and they need different data:
- Did it get funded at all? — You cannot answer this from a dataset with no failures.
- Given that it got funded, how much did it raise? — This you can answer, because the survivors are exactly the population you care about.
So I went and found data that does remember the failures. A widely-used Kaggle export covers 2009–2018 and includes the flops; an academic dataset from ICPSR covers 2009–2023 with all 610,000 Kickstarter projects, successes and failures alike.4 Triangulating across three independent sources — using the failure-aware ones for “did it fund” and the rich Web Robots crawl for “how much” — is the backbone of everything below.
When you bring the failures back, the real tabletop success rate isn’t 98%. It’s about two-thirds over 2009–2018, climbing to roughly 86% by 2023.5 Tabletop has quietly become one of the most forgiving categories on the platform — but it got there gradually, and the reason turns out to be interesting.
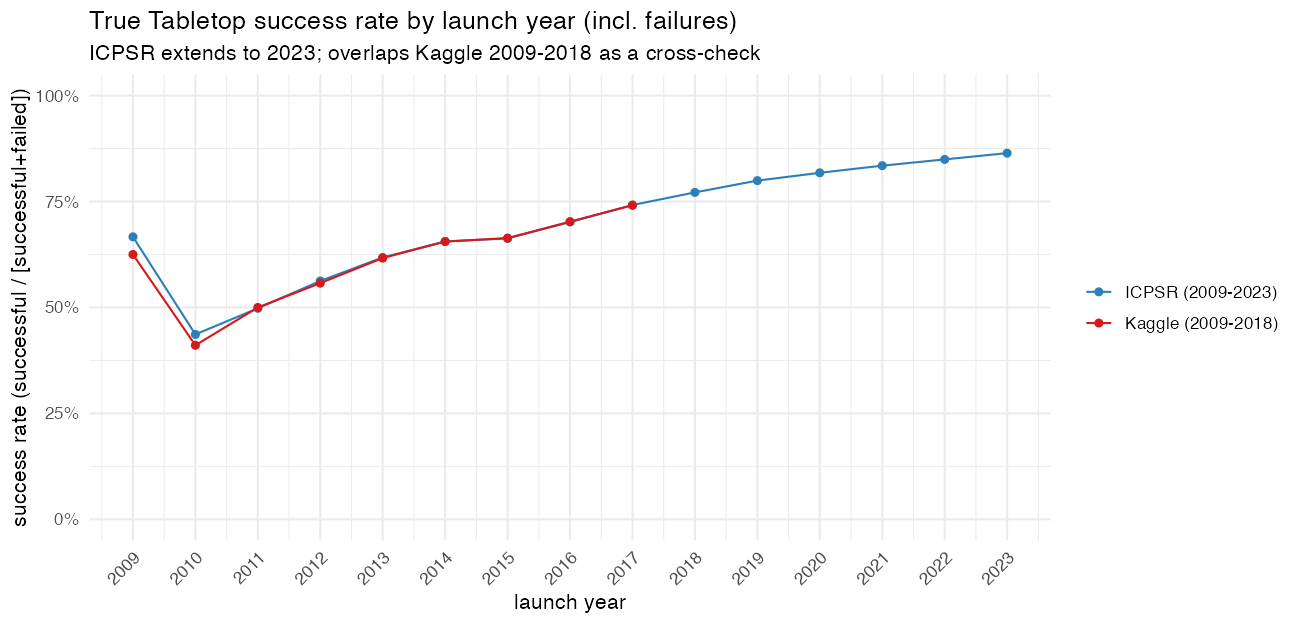
The real success rate (successes ÷ finished projects), once you put the failures back in. Two independent datasets agree closely through 2018; the longer one carries the story up to ~86% by 2023.
What the RPG shelf actually looks like
Start with the shape of the money, among funded projects. It is brutally top-heavy. The top 1% of funded RPG projects capture about 36% of all the dollars; the top 5% capture nearly two-thirds. For accessories it’s even more concentrated — the top 1% pull in 46%. The whale post wasn’t studying a weird fringe; it was studying the part of the distribution where almost all the money actually is.
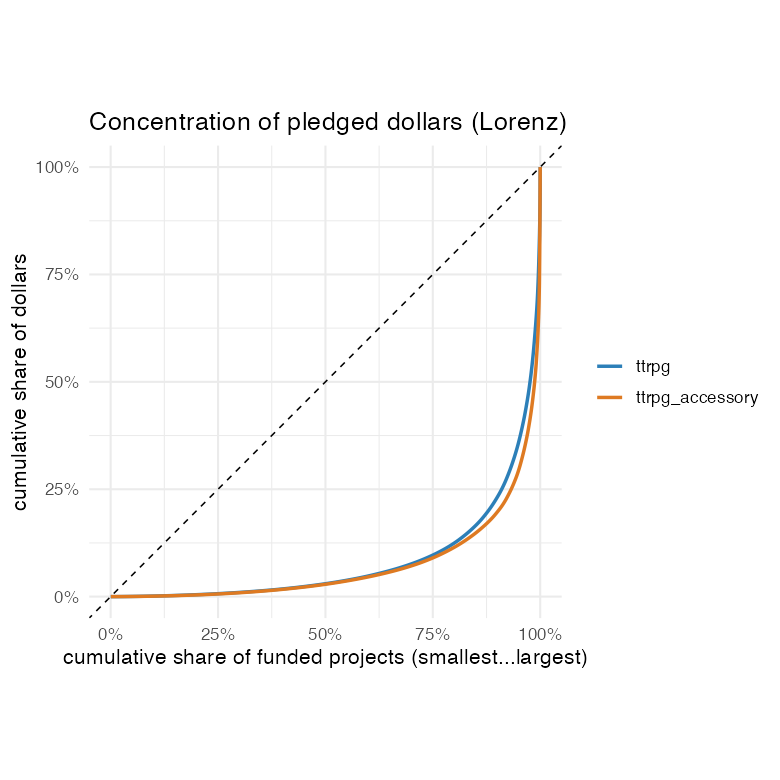
How concentrated the money is. The sharp bend near the right edge means a tiny share of projects holds most of the dollars; a straight diagonal would mean perfect equality.
The typical project is far humbler. A median funded RPG book raises around $6,000 from a bit over 200 backers; a median funded RPG accessory (dice, minis, a GM screen) raises about $2,600 from roughly 100 backers. Here’s a detail I liked: the per-backer pledge is nearly identical for the two — about $30 either way. So RPG books pull ahead by attracting roughly twice as many backers at that same price point. The gap comes from demand — how many people show up — while the spend per person barely moves.
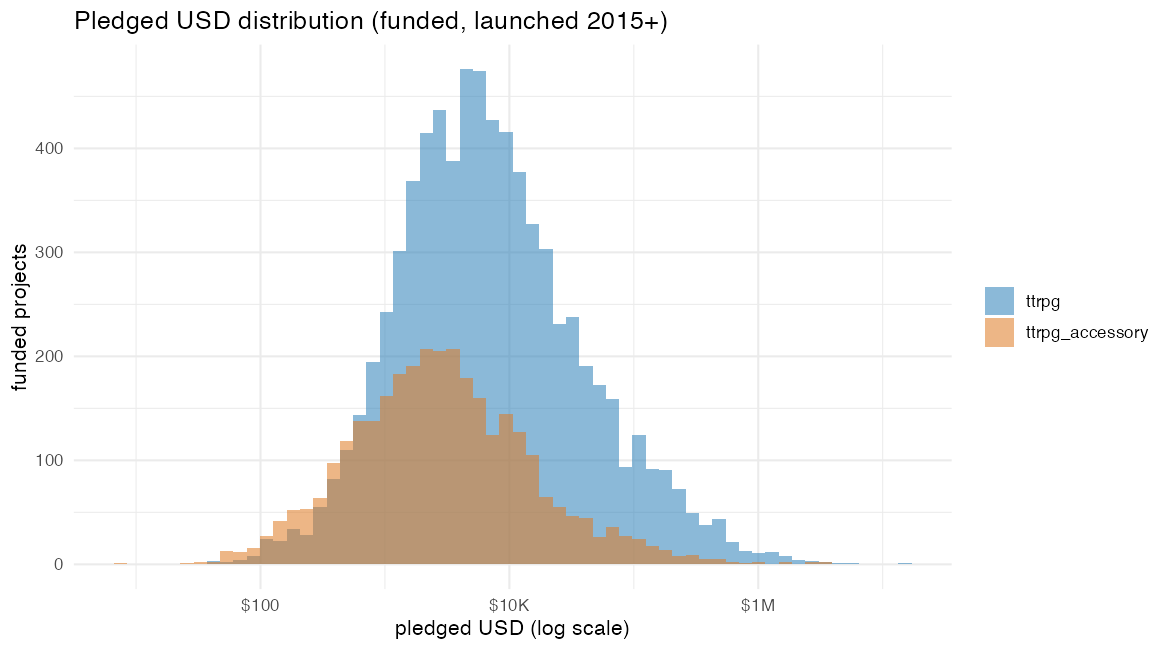
What funded projects raise (log scale). RPG books sit to the right of accessories — they raise more — but both distributions have a long tail reaching toward the millions.
Accessories, meanwhile, play a different game. Their median funding goal is $300 — basically a formality — and they blow past it: 88% of funded accessories raise at least double their goal, versus 75% for books. “Set a tiny goal and overfund” is a genuine strategy, and it’s especially an accessory move.
What actually predicts getting funded: who, not what
Now the question the survivor data couldn’t speak to. Using the failure-inclusive datasets, I built models to predict funding success and — importantly — checked how well they did out-of-sample, not just how nicely they fit.6
Two models, two different kinds of information. One knew only about the creator: how many projects they’d run before, how many succeeded, how many failed. The other knew only about the project: its genre, its goal, its country, its title.
The creator model won, and not by a little — it predicted funding substantially better than the project model.7 On Kickstarter’s RPG shelf, who is asking matters more than what they’re asking for. A creator’s prior track record is the strongest single predictor I found: each past success multiplies the odds of funding, a strong prior success rate multiplies them a lot, and — symmetrically — past failures predict future failure. Reputation compounds in both directions.
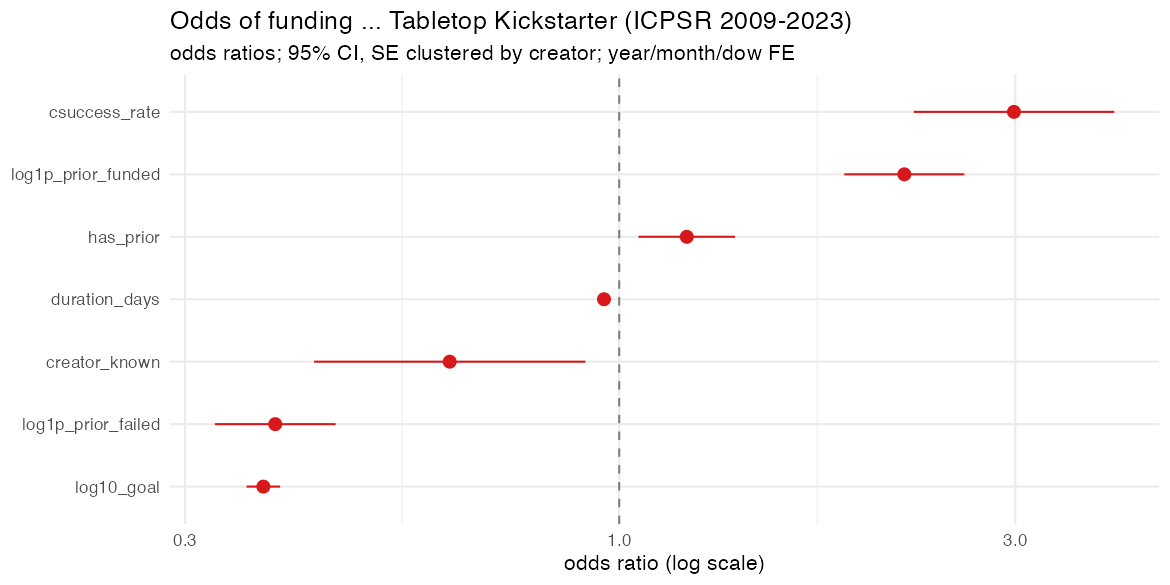
What predicts getting funded, from the creator-history model (odds ratios). Bars to the right of 1 improve the odds — a strong prior success rate most of all — while prior failures (left of 1) drag them down.
This also explains the rising success rate. As the platform ages, a bigger and bigger share of launches come from people who’ve done it before and succeeded. The market didn’t necessarily get easier; the launchers got more experienced.
The project attributes still matter, just less. Holding other things equal: an actual RPG is more likely to fund than a board or card game; a “5E-compatible” or D&D/Pathfinder label helps further; US-based projects do a bit better. And there’s the perennial Kickstarter finding — modest goals fund more reliably. Each tenfold increase in the goal cuts the odds of funding by roughly two-thirds.
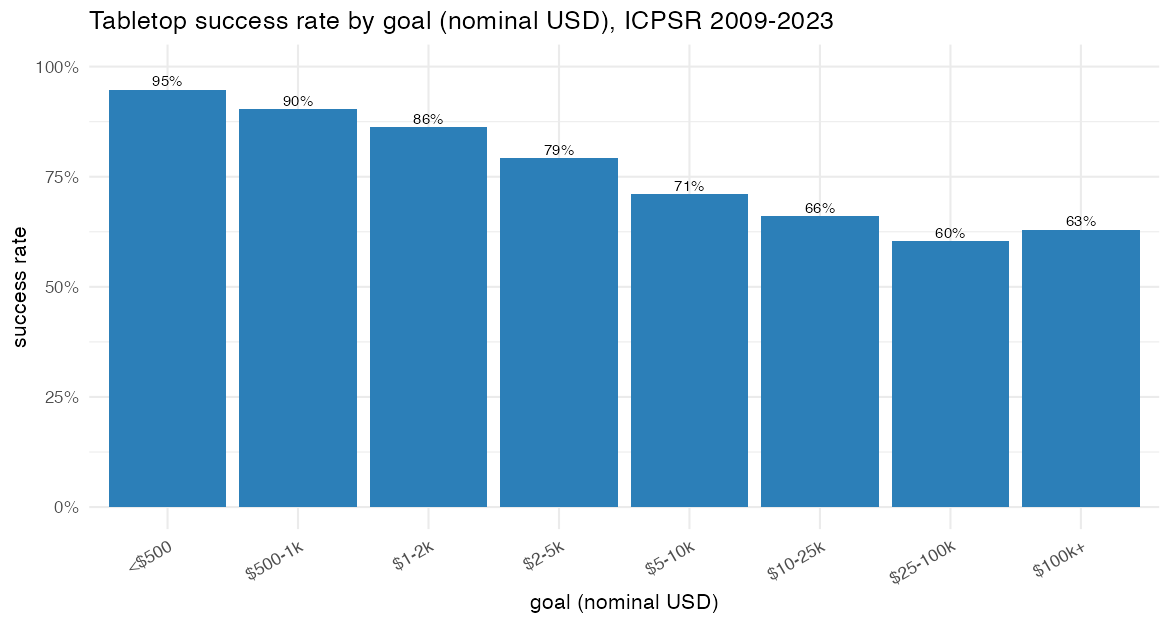
Success falls steadily as the goal climbs. But read this as “who sets what,” not as a lever — cautious creators with small audiences are the ones choosing the small goals.
A warning on that last one, because it’s the most misread statistic in all of crowdfunding: this is a correlation, and the goal is not randomly assigned. Creators set goals in anticipation of demand — a cautious creator with a small audience sets $2,000; a publisher with a big mailing list confidently sets $80,000. So “low goals succeed more” absolutely does not mean “lower your goal and you’ll succeed.” The number tells you which kind of creator picks which kind of goal; what would happen if a given creator trimmed their own is a question it simply can’t answer. (I’ll come back to this trap.)
What predicts raising a lot (once you’ve already won)
For the magnitude question — how big does a funded project get — I switched back to the rich Web Robots data, which is exactly the funded population. The standouts, expressed as “multiply the dollars by roughly”:
- A Kickstarter staff pick (“Projects We Love”): ×2.6. By far the strongest factor in the list.
- A repeat creator: ×1.4. The backer-base premium again.
- Having a video: ×1.13. Modest but real.
- Being a zine: ×0.73. Zines are small by design.
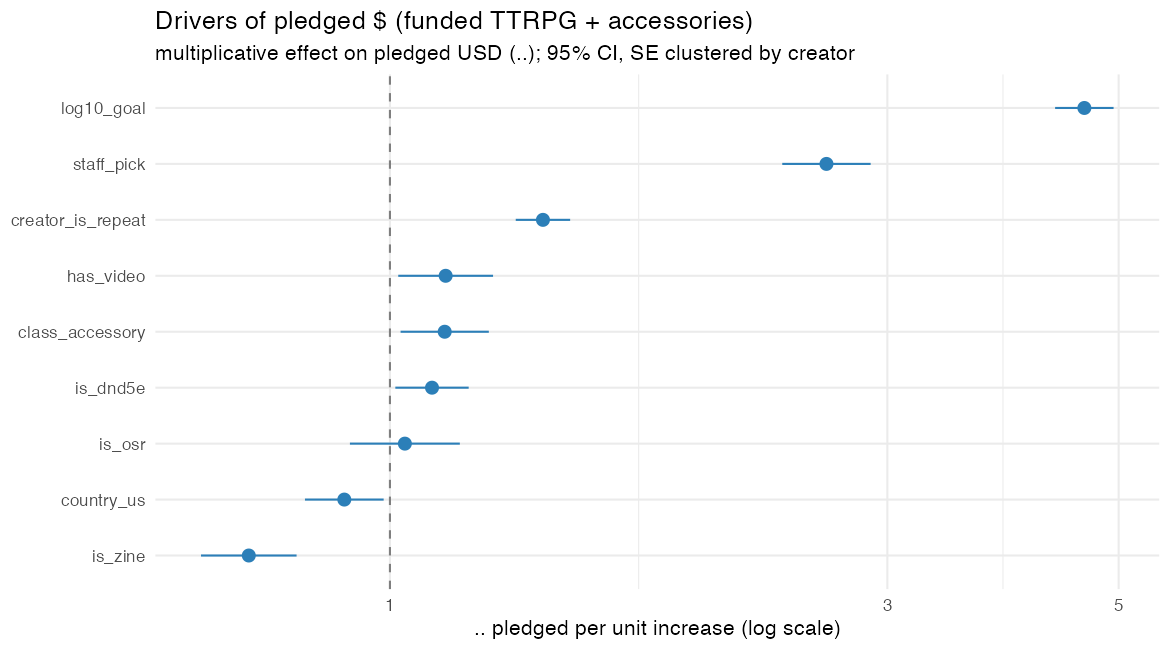
Correlates of raising more, among funded projects — multiply the dollars by the value on the axis. A “Projects We Love” staff pick travels with ~2.6× the money; a zine, with less.
I’m deliberately leaving the funding goal off that list even though it has the largest coefficient, because for funded projects its effect is mostly mechanical: if you raised enough to succeed, you by definition cleared your goal, so a bigger goal mechanically sets a higher floor.8 It’s bookkeeping, and I treat it that way.
Two richer wrinkles. First, I fed the campaign text — titles and blurbs — into the model to see if the wording tells us anything beyond the obvious numbers. It does, modestly, and the pattern is a clean premium-versus-commodity axis: words like “diorama,” “scenery,” “miniatures,” “softcover,” and “collectors” predict raising more, while “pay what you want,” generic “dnd dice,” and “quality resin” predict raising less.9 Presentation as a deluxe object pulls money in; presentation as a cheap commodity doesn’t.
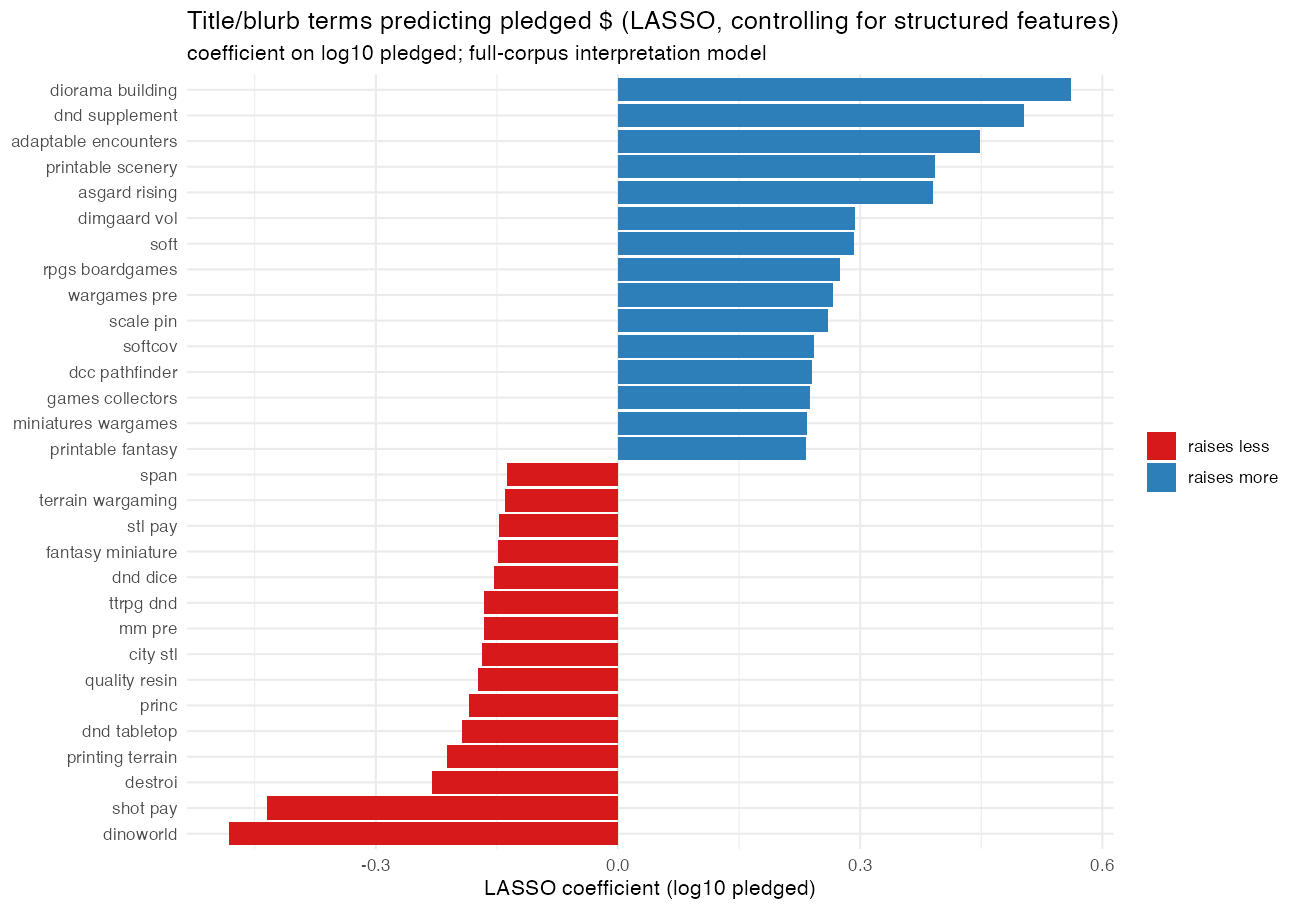
The words that move money, after controlling for everything else. Premium/deluxe language (blue) predicts bigger raises; commodity and pay-what-you-want language (red) predicts smaller ones.
Second — and this is the kind of thing only a big dataset lets you ask — the staff-pick and video effects get stronger the further up the distribution you go. For a median project a staff pick is worth maybe 1.5×; for the runaway hits near the top it’s associated with more like 3.5×. Social proof and polish are amplified in exactly the tail where the whales live. (Correlation again — Kickstarter may hand out staff picks to projects it can already tell will be big — but it’s a suggestive pattern.)
Books and accessories play by different rules — but only for one question
Because I’d split RPG books from RPG accessories, I could ask whether they respond to the same things. The answer is a tidy little asymmetry.
For how much you raise, the drivers genuinely differ. The starkest example: a “5E-compatible” label raises money for a rulebook but is slightly negative for an accessory.10 That makes intuitive sense — a branded D&D book is a selling point, but generic “D&D dice” or “D&D minis” are a commodity in a crowded field. Being US-based flips sign too.
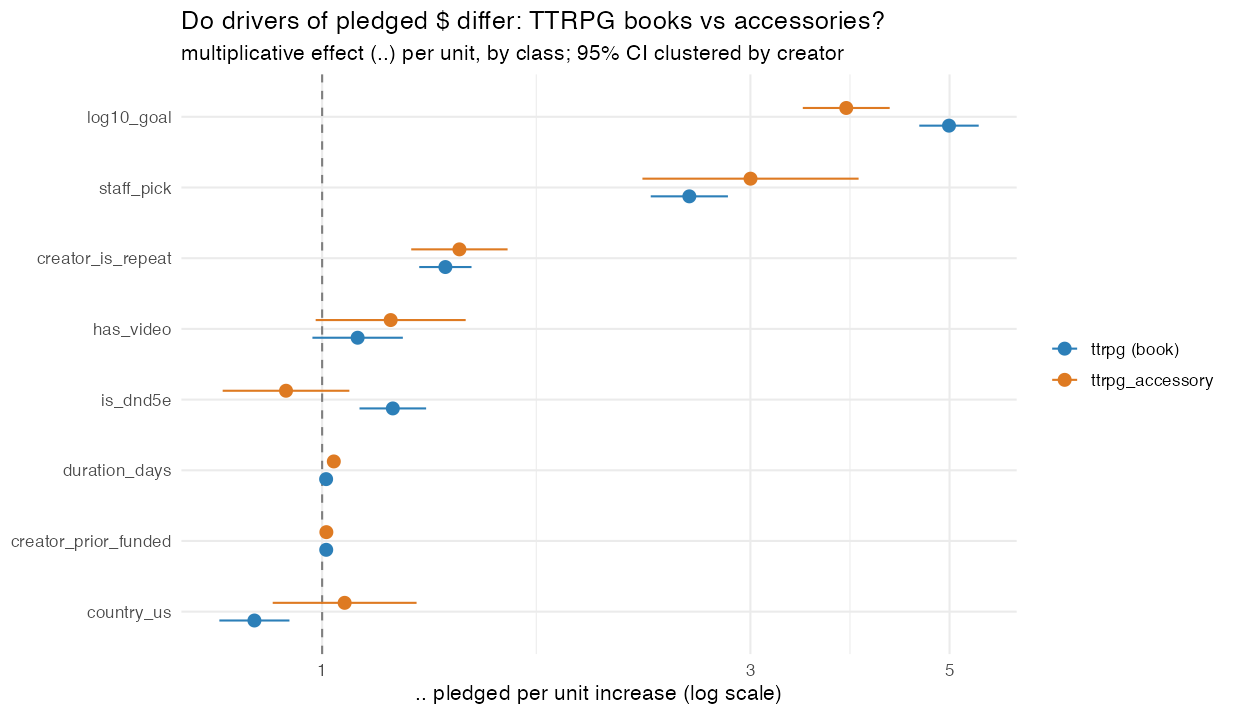
Same drivers, different products. The book effect (blue) and accessory effect (orange) pull apart — most strikingly for the 5E label, which lifts books but not commodity minis.
For whether you get funded, though, the drivers don’t meaningfully differ between books and accessories. The things that get you across the funding line — a modest goal, a reasonable campaign length, an established creator — seem to work about the same regardless of what you’re selling.
So: product type shapes how much you raise, but not whether you raise it. The recipe for crossing the line is general; the recipe for getting big is product-specific.
Did D&D’s fifth edition cause the boom? (It doesn’t look like it.)
Now for the fun part: causation. It’s tempting to look at the rising RPG fortunes of the last decade and credit obvious cultural events — 5th edition in 2014, Stranger Things, Critical Role. Tempting, but mostly unprovable, and in one case provably wrong.
The honest way to test “did event X cause the RPG surge” is a difference-in-differences: compare RPGs (which event X should affect) against board and card games (which it shouldn’t) before and after, so the platform-wide trend cancels out. When I do this for 5th edition’s mid-2014 release, the result is a clean null. The RPG advantage over other tabletop games was already there in 2012, two years before 5e shipped, and it just… continued. There’s no break at the release.11
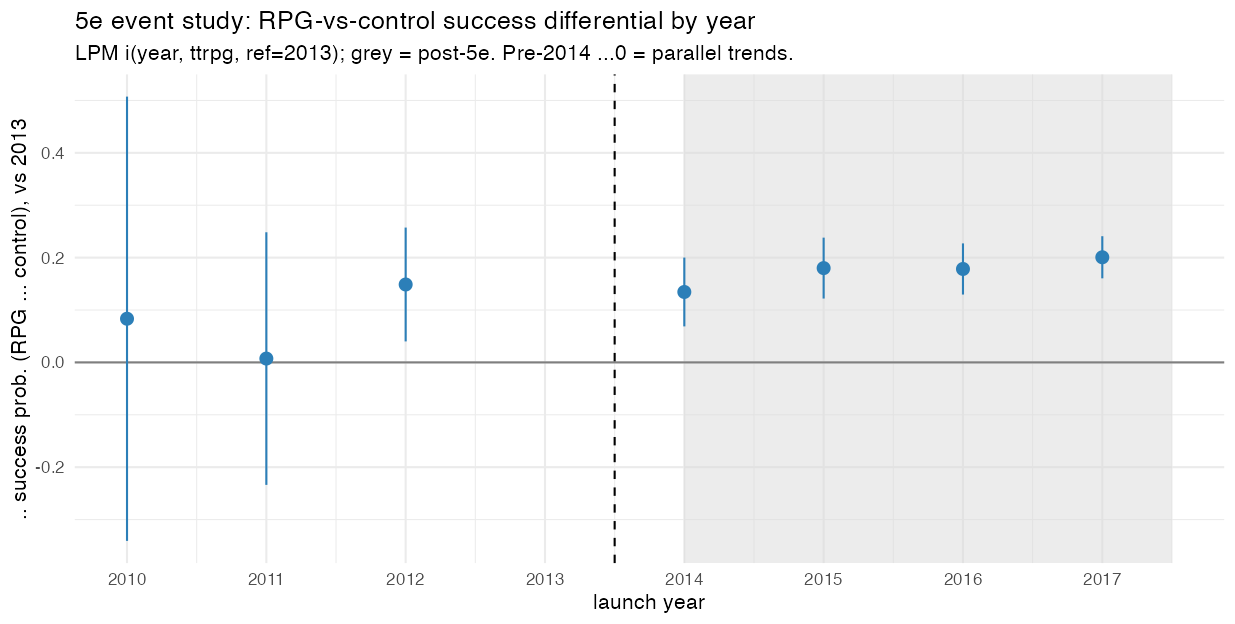
The 5e “effect” that wasn’t. The RPG-vs-control success gap is already positive in 2012 and flat across the mid-2014 release (dashed line) — no jump, no clean causal story.
The boom is real, but pinning it on 5e specifically doesn’t survive contact with the data — the treatment was too gradual and too anticipated, and 5e probably lifted D&D board games too, contaminating the comparison. Stranger Things and Critical Role are even harder to test cleanly, so I won’t pretend to.
One event does leave a fingerprint, and tellingly it comes from the platform itself: ZineQuest, Kickstarter’s annual February push for RPG zines, launched in 2019. This one is close to a natural experiment, precisely because it’s RPG-specific — Kickstarter promotes RPG zines, not board games, so board games make an honest control group. And the effect is unmistakable: funded RPG launches roughly double every February in the ZineQuest era, relative to what the season and the trend would predict, with no such jump beforehand.12 But the mechanism is a nice twist. ZineQuest worked through sheer volume: it summoned a flood of small zines that would never otherwise have launched, while leaving the size of the typical project untouched. The February cohort is 41% zines (versus 3% the rest of the year), and its median pledge is less than half the usual. The program lowered the barrier to small-format publishing and a lot of people walked through the door, exactly as intended.
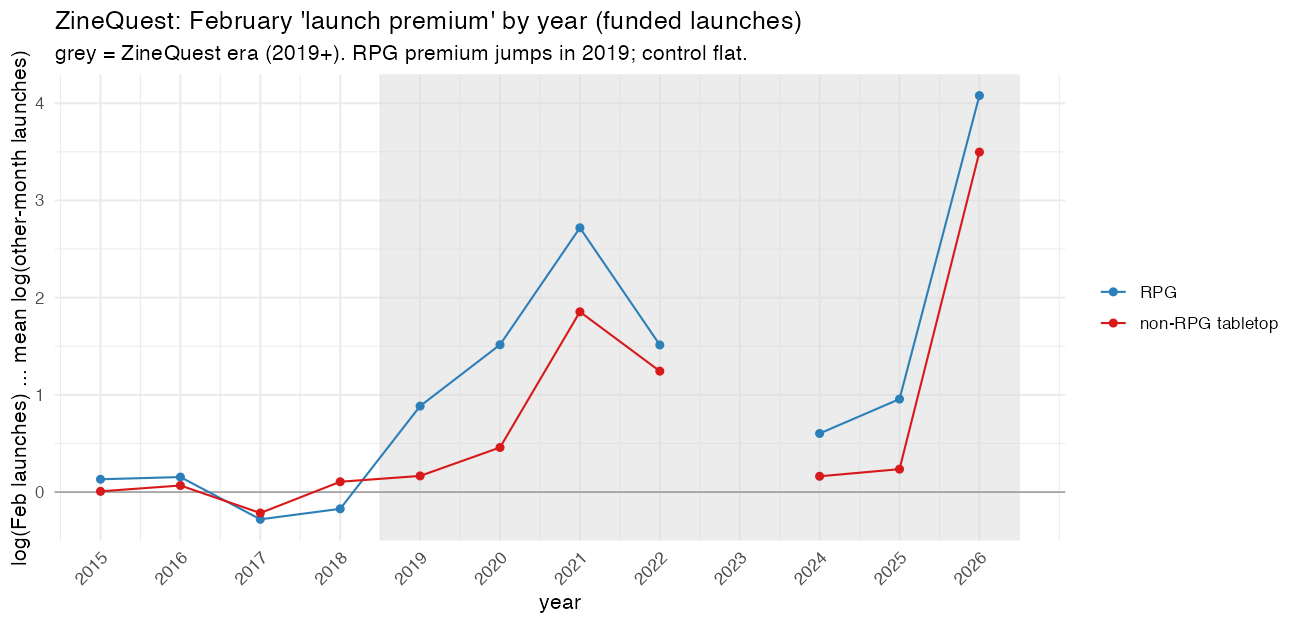
ZineQuest’s fingerprint. The February “launch premium” for RPGs (blue) is ordinary and flat before 2019, then jumps when the program starts and stays elevated — while the board-game control (red) does not.
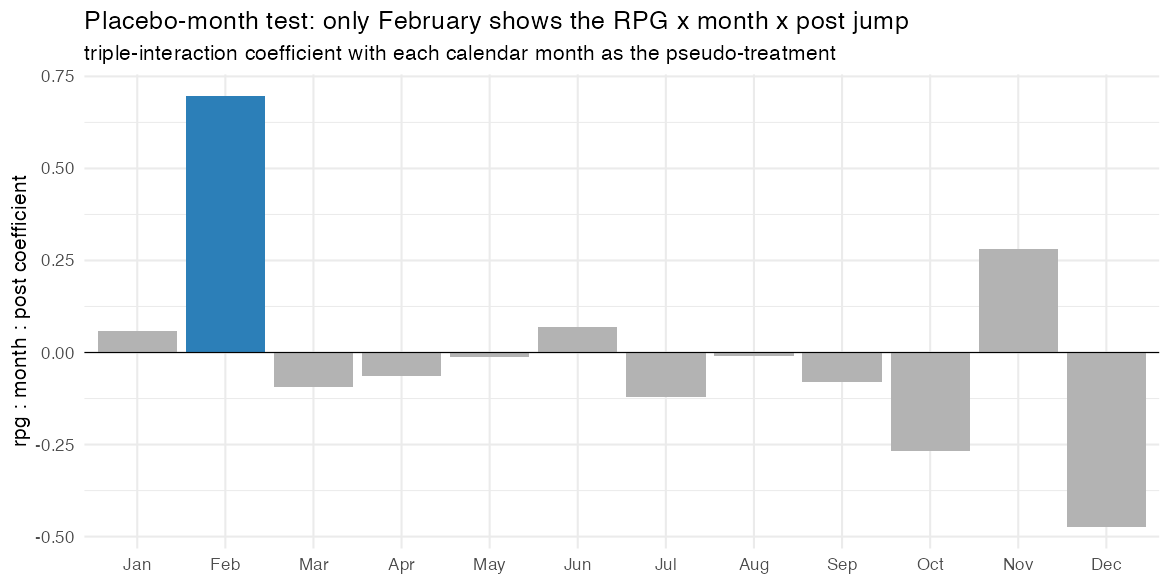
A placebo check: re-run the test pretending each month is the “treatment.” Only February (highlighted) shows the jump — strong evidence the effect is ZineQuest, not noise.
I’d have loved to study the 2023 OGL crisis — Wizards of the Coast’s botched attempt to revise the Open Game License, which genuinely panicked RPG creators — as a shock to the system. Unfortunately I can’t, and the reason is almost poetic: the Web Robots crawl has a gap in its coverage that sits exactly on top of January 2023, and the only failure-aware source that reaches that far masks project names so I can’t tell the RPGs apart.13 Sometimes the data just isn’t there, and saying so is part of the job.
So What?
If you’re running an RPG Kickstarter, the evidence-backed takeaways are: your track record is your biggest asset (and your past failures follow you); a modest goal correlates with funding, though that mostly reflects which creators set small goals in the first place; a staff pick and a video travel with much bigger raises; and how you frame the product — premium object versus cheap commodity — shows up in the dollars.
What I wouldn’t tell you is that any of these are guaranteed levers. Almost everything here is a correlation drawn from observational data, with all the usual hazards: creators choose their goals strategically, Kickstarter chooses who gets staff-picked, my RPG classifier is right only about three-quarters of the time,2 and the one genuinely causal result I have is about a niche February program for zines. The most useful move in this whole exercise was almost embarrassingly simple: I noticed that the obvious dataset quietly omitted every failure, and went to dig up the ones that did.
The whale post asked how the giants price their tiers. I can’t see reward tiers in my data at all — that detail lives only on individual campaign pages and would take a careful scrape to recover, which is a possible next step.14 But zooming out from the fifty-three giants to the full forty-five thousand, the RPG corner of Kickstarter turns out to be a place where a handful of whales hold most of the money, most projects are small and increasingly likely to succeed, reputation compounds, and a small February nudge from the platform can summon a swarm of zines. Not a bad portrait, for a pile of monthly crawls and a healthy refusal to trust them.
Footnotes
The original analysis (“Kickstarter Whales,” guest post by Scipio202 on Patchwork Paladin) used ENWorld’s list of 53 tabletop RPG campaigns that raised ≥ $1,000,000 and tracked four price points per campaign (cheapest digital, cheapest physical, most-common, and the top “whale” tier). It’s a tier-level study of mega-successes; this post is a population-level study of the whole category. ↩
Sorting RPGs out of “tabletop” is genuinely fuzzy, because the clues that mark something as an RPG often live in the blurb, not the title. I validated the classifier on a fresh hand-labeled sample it had never seen: about 77% precision and 71% recall for the core-RPG class. That’s good but imperfect, and the imperfection mostly behaves like random noise in the labels — which understates differences between categories rather than inventing them. So the contrasts I report are, if anything, conservative. ↩ ↩2
Concretely: in the Web Robots data only about 2% of finished tabletop projects are marked “failed,” versus a real-world failure rate somewhere around a third to a half. The crawl is essentially “the successful subset.” A reassuring cross-check: where the survivor data and the failure-aware data overlap, the funded projects’ dollar amounts and backer counts match almost exactly — so the bias is in which projects appear, not in the numbers attached to them. ↩
The three sources have complementary strengths and weaknesses. Web Robots: rich detail (video, staff pick, full text, creator IDs), 2014–2026, but funded-biased. Kaggle “ks-projects”: includes failures and project names, but ends in early 2018. ICPSR 38050: includes failures through 2023 and has a usable creator ID, but masks project names (so I can identify RPGs only by linking to the other two). No single source does everything; the analysis assigns each question to the source that can answer it honestly. ↩
“Success rate” here is successful ÷ (successful + failed), the standard convention. The two independent failure-aware sources agree closely on the 2009–2018 overlap (about 67% vs 69%), which is the kind of cross-source agreement that makes me trust the number. ↩
I report out-of-sample discrimination (AUC, the area under the ROC curve): 0.5 is a coin flip, 1.0 is perfect. I also checked several model types (logistic regression, LASSO, random forest) and they agreed, which is a sign the result isn’t an artifact of one method. ↩
The creator-history model reached an AUC of about 0.83; the project-attribute model about 0.72. They’re built on different datasets (only one source has creator IDs and failures; only the other has project names), so this is a decomposition across sources rather than a head-to-head in one regression — but it’s robust, and “reputation beats genre” is the clear message. ↩
Among funded projects, pledged dollars are ≥ the goal essentially by definition (I checked: 0.00% of funded projects came in under goal). So the strong goal-pledged relationship for funded projects is largely an accounting identity, not behavior. I keep the goal in the model only to hold project scale constant while reading the other coefficients. ↩
Method, briefly: I turned titles and blurbs into a bag of words and bigrams and let a LASSO pick which ones predict log-dollars, with the vocabulary chosen separately inside each cross-validation fold so the test data couldn’t leak in. Adding text lifted out-of-sample R² from about 0.66 to 0.70 — real but modest. One caveat: a bag-of-words model also memorizes specific series and brand names, which don’t generalize; the premium-vs-commodity pattern is the part worth keeping. ↩
Formally, a joint test that all the book-vs-accessory differences are zero is decisively rejected (p < 0.00001) for the magnitude question, but is not significant (p ≈ 0.07) for the funding question. Translation: the slopes really do differ for “how much,” but not for “whether.” ↩
In an event study, the RPG-vs-control success gap is already positive and sizable in 2012 and flat thereafter; the formal “did the gap jump after mid-2014” interaction is statistically indistinguishable from zero for both funding and dollars. This is a textbook example of why diffuse, anticipated “events” resist clean causal identification. ↩
The estimate is about a 2× increase in funded RPG February launches. Because the comparison effectively has only ~12 years of data (“clusters”), a naive significance test overstates confidence; I re-ran it with a wild cluster bootstrap and a placebo test that asks whether any other month shows the same jump (none does — February is the unique outlier). The effect holds up. It’s also worth noting this measures funded entry and dollars, not the success rate, since the rich data still can’t see failures. ↩
Two independent problems collide on the OGL window: a source-side hole in the monthly crawl from mid-2022 to mid-2023 (which I verified is real, not a mistake on my end), and the name-masking in the only failure-aware source that reaches 2023. With neither entry, success, nor dollars observable for RPGs around January 2023, an honest event study isn’t possible. A targeted re-scrape of that window is the way to revive it. ↩
Reward-tier data — the entry-vs-whale breakdown the original post studied — simply isn’t in any of these datasets; they only carry campaign-level totals. The closest I can get is average pledge (dollars ÷ backers), which is why the whale-tier question stays open here. Recovering it would mean scraping individual campaign pages, carefully and within Kickstarter’s terms. ↩